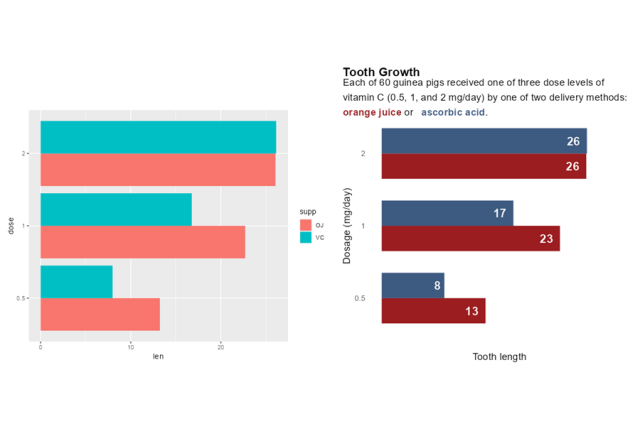
The data visualisation guidance for the Royal Statistical Society that I've been working on over the past few months with Brian Tarran and Andreas Krause has now been published and is freely available online 🎉
If you're someone who makes charts, please have a look through the website (built with #QuartoPub) and let us know your thoughts. There are lots of examples of plots built with #RStats (and a few #Python ones as well)!
RSS press release link: https://rss.org.uk/news-publication/news-publications/2023/general-news/rss-publishes-new-data-visualisation-guide/
