Search
Items tagged with: dataViz
Reached the end of the line with your #GeoPandas plots? Replace them with maps rendered by QGIS.
http://anitagraser.com/2023/11/10/bringing-qgis-maps-into-jupyter-notebooks/
#maps #GISChat #DataScience #SpatialDataScience #DataViz #GIS
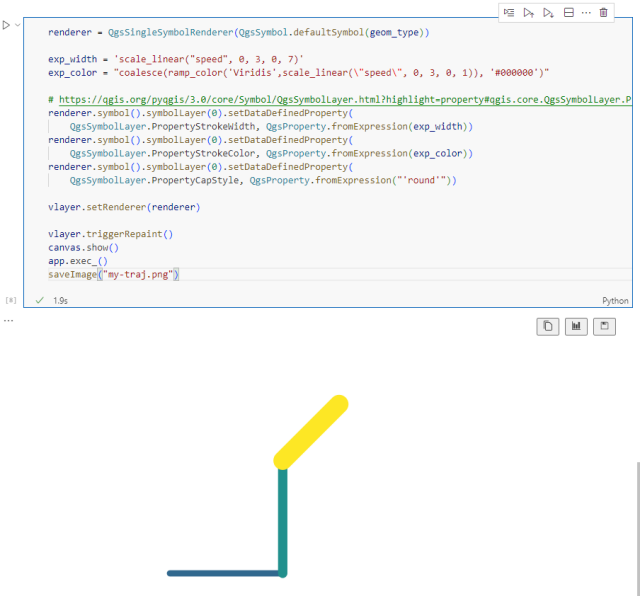
Bringing QGIS maps into Jupyter notebooks
Earlier this year, we explored how to use PyQGIS in Juypter notebooks to run QGIS Processing tools from a notebook and visualize the Processing results using GeoPandas plots. Today, we’ll go …Free and Open Source GIS Ramblings
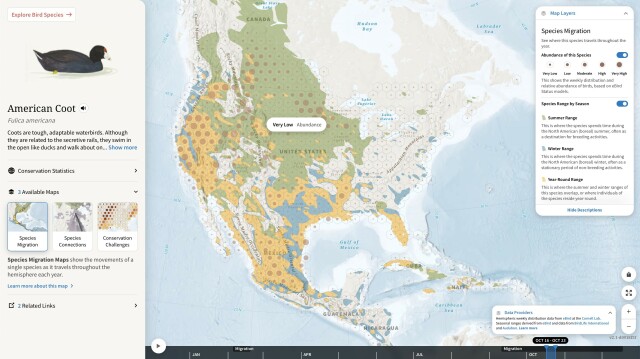
https://explorer.audubon.org/explore/species/1527/american-coot/migration
#ornithology #dataviz #maps
American Coot - Migration Map | Bird Migration Explorer
See where the American Coot travels throughout the hemisphere each year.explorer.audubon.org
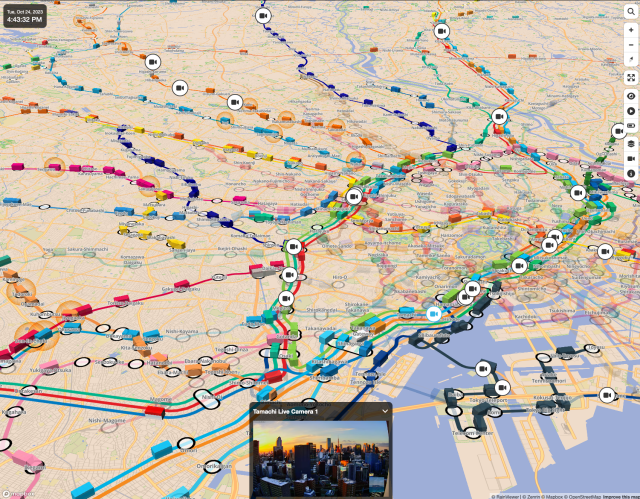
https://minitokyo3d.com/
#DataViz #TransportMap
Mini Tokyo 3D
A real-time 3D digital map of Tokyo's public transport system. This data visualization was produced by Akihiko Kusanagi.Mini Tokyo 3D
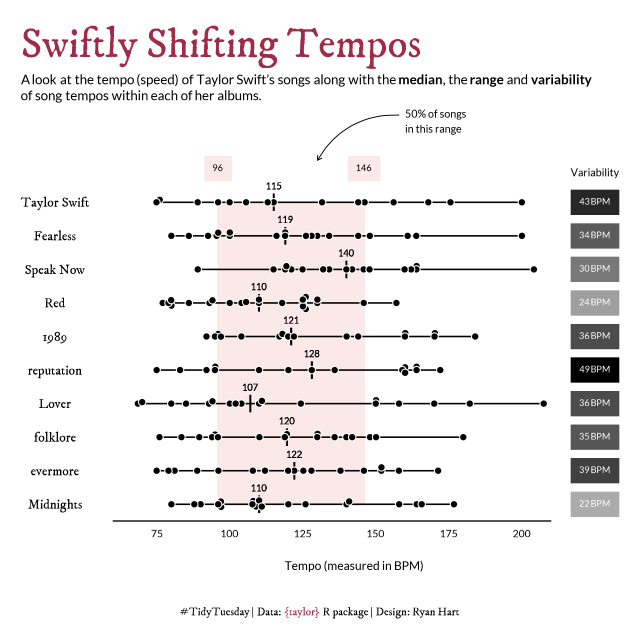
Initial hypothesis ... Swift's early albums would have songs with slower tempos due to her country roots.
Not true. Shifting song tempos not tied to genre.
code: https://github.com/curatedmess/TidyTuesday/blob/main/2023/10172023/taylor_tempo.R
#rstats #dataviz #ggplot2
5-minute YouTube video from last year's RStudio Conference (2022): https://www.youtube.com/watch?v=ChwczkfFsXM&list=PL9HYL-VRX0oTw-6TQri7Fr97G3IX0tHh8&index=277
Presentation materials: https://www.mjskay.com/presentations/rstudio-conf-2022-talk.pdf
By @mjskay
#dataviz #ggplot #ggplot2 @rstats
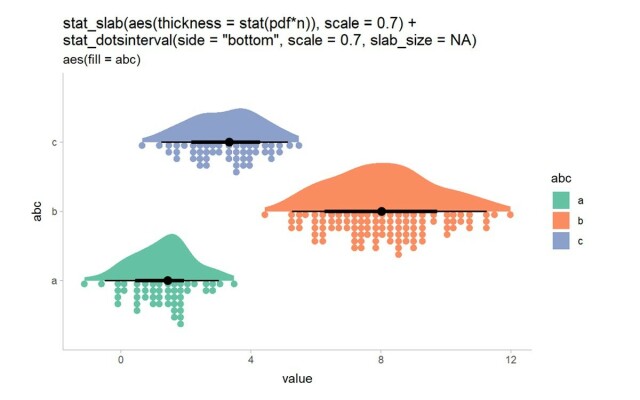
Matthew Kay | Visualizing distributions and uncertainty using ggdist | RStudio (2022)
I propose a talk on visualizing distributions and uncertainty using {ggdist}. I will describe how to think systematically about distributional visualization ...YouTube
Si possono cercare per specie e per provincia... per andarli ad ammirare!
http://trovawiki.altervista.org/alberi_monumentali.php
@napo
@nelsonmau
@nilocram
@insopportabile
@martinapugliese
@openstreetmap
@pcmasuzzo
@piersoft2
@pigreco71
@poliversity
@puntofisso
@PINE64
#dataviz #map #nature #tree
🍃 🍂 🌲 🌳

24 hours in an invisible epidemic
Watch 24 hours of an American day, and the invisible crisis hiding in plain sightThe Pudding
https://climate.nasa.gov/climate_resources/300/video-climate-spiral/ #dataviz #boost #climatechange #climate
Video: Climate Spiral (1880-2022) – Climate Change: Vital Signs of the Planet
The visualization shows monthly global temperature anomalies (changes from an average) between the years 1880 and 2022.Climate Change: Vital Signs of the Planet
For the full article see https://www.ft.com/content/51fca6b6-8a4c-4113-b59a-da8027b97648
Ht @sdbernard
#dataviz #gistribe
Climate graphic of the week: Catastrophic Libyan flooding fuelled by warming oceans
An intense cyclone known as a ‘medicane’ led to more than 400mm of rain falling in 24 hoursMartha Muir (Financial Times)
The @R4DSCommunity is now a fiscally sponsored member of the Open Collective Foundation (https://opencollective.foundation).
That means donations to the R4DS Online Learning Community are now tax-deductible in the United States!
If we have helped you learn #RStats on our r4ds.io/join Slack or through #TidyTuesday, please consider making a one-time or recurring donation at https://r4ds.io/sponsor
#DataViz #PyData #JuliaLang

Open Collective Foundation
OC Foundation offers nonprofit status + fundraising + money management software to aligned groups.opencollective.foundation

