Search
Items tagged with: dataviz
Climate analogues project strong regional differences in the future water and electricity demand across US cities (2023): https://www.cell.com/one-earth/fulltext/S2590-3322(23)00454-2 @climate
#analogs #analogues #climateChange #climate #projections #dataViz #map #maps #classification #USA #DC #LA #SF #SFBA #Chicago #Portland #Seattle #Dallas


Climatic analogs for some US urban areas in the late 21st century:
https://www.nature.com/articles/s41467-019-08540-3 @climate
#climateChange #climate #projections #dataViz #map #analog #classification
 and circle size indicates increasingly poor analogs. Colored diamonds and bold lines indicate contemporary climatic analogs for the ensemble mean across the 27 individual projections.")
Contemporary climatic analogs for 540 North American urban areas in the late 21st century - Nature Communications
It is challenging to communicate abstract future climate estimates. Here the authors utilized climate-analog mapping and they identified that North American urban areas’ climate by the 2080’s will become similar to the contemporary climate of locatio…Nature

Neat maps of #AsianFood in the US from Pew Research Center:
via FlowingData newsletter (Nathan Yau) and Pew study authors Sono Shah and Regina Widjaya (none of whom are on Mastodon)
#DataViz #Cartography #maps #visualization

Most Asian restaurants serve Chinese, Japanese or Thai food in the US | Pew Research Center
In the U.S., 12% of all restaurants serve Asian food; that share is slightly higher than the 7% of the U.S. population that is Asian American.Pew Research Center
Our paper with Paul Murrell about color palettes in base R is now published in The ![]() Journal:
Journal:
Coloring in R's Blind Spot
https://doi.org/10.32614/RJ-2023-071
 and provided very few alternative palettes, most of which also had poor perceptual properties (like the infamous rainbow palette). Starting with version 4.0.0 R gained a new and much improved default palette and, in addition, a selection of more than 100 well-established palettes are now available via the functions palette.colors() and hcl.colors(). The former provides a range of popular qualitative palettes for categorical data while the latter closely approximates many popular sequential and diverging palettes by systematically varying the perceptual hue, chroma, and luminance (HCL) properties in the palette. This paper provides a mix of contributions including an overview of the new color functions and the palettes they provide along with advice about which palettes are appropriate for specific tasks, especially with regard to making them accessible to viewers with color vision deficiencies.")
 function. The label above each swatch shows the argument to provide to palette.colors() to produce the set of colors. The palette at top-left is the new default that is also produced by palette(). The \"Okabe-Ito\" palette is the default that is produced by palette.colors() (with no arguments).")
 and \"Viridis\" (right) palettes. These plots are created by the colorspace::specplot() function. For \"YlGnBu\" we can see that hue changes from blue to yellow, luminance increases monotonically, and chroma has a small peak in the blue range and then decreases with luminance. \"Viridis\", on the other hand, has almost the same trajectory for both hue and luminance, but chroma increases for the light colors.")
, hcl.colors()
List: palette.pals(), hcl.pals(\"qualitative\")
Robust: \"Okabe-Ito\", \"R4\"
Sequential:
Purpose: Ordered or numeric data (high → low)
Generate: hcl.colors()
List: hcl.pals(\"sequential\")
Robust: \"Blues 3\", \"YlGnBu\", \"Viridis\"
Diverging:
Purpose: Ordered or numeric data with a central value (high ←
neutral → low)
Generate: hcl.colors()
List: hcl.pals(\"diverging\"), hcl.pals(\"divergingx\")
Robust: \"Purple-Green\", \"Blue-Red 3\"")
Data Illustrator: Create infographics and data visualizations without programming
Create Infographics and Data Visualizations without Programmingdata-illustrator.cs.umd.edu
‼️ 1/2 New year, new R package, new rayshader update, new slick Quarto website, new blog post! 5x the new! Introducing the {raybevel} package: generate 3D buildings, 3D beveled polygons, 2D inset polygons, and calculate straight skeletons entirely in R! The rayshader update features tons of improvements, including blazing fast 3D contour and line drawing.
Blog post:
https://www.tylermw.com/posts/rayverse/raybevel-introduction.html
HAPPY NEW YEAR!
#RStats #rayshader #rayrender #raybevel #rayverse #dataviz
Stop what you're doing and read this heart-breaking essay about Long Covid written by Giorgia Lupi:
https://www.nytimes.com/interactive/2023/12/14/opinion/my-life-with-long-covid.html
It shows how large the impact of this type of disease can be and what it does to the lives of people who suffer from it.
I think this is the most emotionally touching piece of #dataviz / essay / opinion piece I have ever read.
If nothing else, it should inspire you to be kind & helpful to others, esp. if they suffer from any kind of disease, chronic or not.

Opinion | My Life With Long Covid
Chronic illness has a way of picking apart your mind and breaking your heart.Giorgia Lupi (The New York Times)
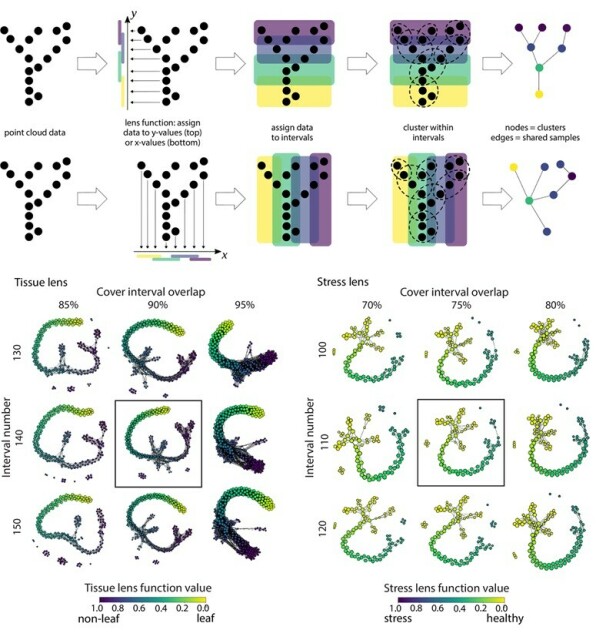
Topological data analysis reveals a core gene expression backbone that defines form and function across flowering plants
Topological Data Analysis shows how gene expression shapes the form and function of flowering plants, which have adapted to dominate Earth’s varied landscapes over 125 million years.plos.io


The world is (still) failing to come close to its climate goals
Progress has been made. But not nearly enoughThe Economist