Search
Items tagged with: DataScience
The last result of this deep sleep-deprivation state is the post "Mapping Categorical Predictors to Numeric With Target Encoding": https://www.blasbenito.com/post/target-encoding/
If you are annoyed by categorical predictors in your data or have heard about "target-encoding" but don't know what it is, this post might interest you!
#Rstats #DataScience

Mapping Categorical Predictors to Numeric With Target Encoding
Target encoding is commonly used to map categorical variables to numeric with the objective of facilitating exploratory data analysis and machine learning modeling. This post covers the basics of this method, and explains how and when to use it.Blas M. Benito (Blas M. Benito, PhD)

We created this dataset by combining deep learning, remote sensing, and extensive field data to build models that can detect and classify individual trees. Models are almost 80% accurate and can be improved with additional field data collection.
https://jabberwocky.weecology.org/2023/11/13/data-on-100-million-individual-trees-in-the-national-ecological-observatory-network/
#ecology #RemoteSensing #DataScience
 The full site and surrounding region; 2) 500 m x 250 m; and 3) 90 m x 150m. The largest scale exhibits clusters and gradients of different colors. At the middle scale small boxes can be seen clustered by color. At the finest scales tree crowns can be seen surrounded by boxes of different colors.")
Data on 100 million individual trees in the National Ecological Observatory Network
We’re excited to announce the initial release of crown maps for 100 million trees in the National Ecological Observatory Network (NEON) with information on location, species identify, size, a…Jabberwocky Ecology
install.packages("stats19")
#rstats #geocompx #gischat #DataScience
Work with Open Road Traffic Casualty Data from Great Britain
Tools to help download, process and analyse the UK road collision data collected using the STATS19 form.docs.ropensci.org
Reached the end of the line with your #GeoPandas plots? Replace them with maps rendered by QGIS.
http://anitagraser.com/2023/11/10/bringing-qgis-maps-into-jupyter-notebooks/
#maps #GISChat #DataScience #SpatialDataScience #DataViz #GIS

Bringing QGIS maps into Jupyter notebooks
Earlier this year, we explored how to use PyQGIS in Juypter notebooks to run QGIS Processing tools from a notebook and visualize the Processing results using GeoPandas plots. Today, we’ll go …Free and Open Source GIS Ramblings
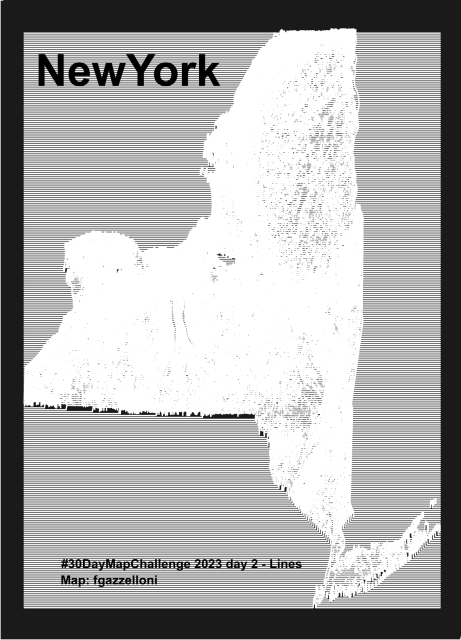
NewYork data from USDA NRCS Geospatial Data Gateway. Made with {topo.ridges} packages
Tools: #R
#rstats #datascience #Datavisualization #maps #infographics
Learn how to organize your projects for seamless collaboration using tools like RMarkdown, renv, version control, and more.
If you've worked with R and want to minimize the pain of sharing and reproducing your work, this course with @eliocamp and @paocorrales is perfect for you: https://www.physalia-courses.org/courses-workshops/r-reproducibility/
#Rstats #Reproducibility #DataScience

Reproducibility data analysis with R
9-12 October 2023 To foster international participation, this course will be held onlinephysalia-courses
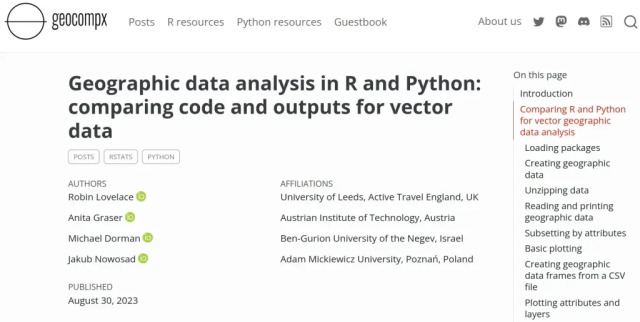
#OpenSource: https://geocompx.org/post/2023/ogh23/
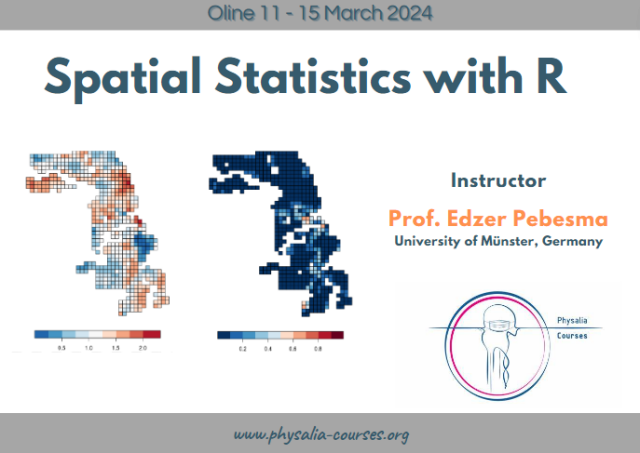
Explore spatial stats: sampling, point patterns, geostatistics, regression models, & machine learning in our course.
Join now: https://physalia-courses.org/courses-workshops/spatial-statistics/
#rspatial #rstats #DataScience
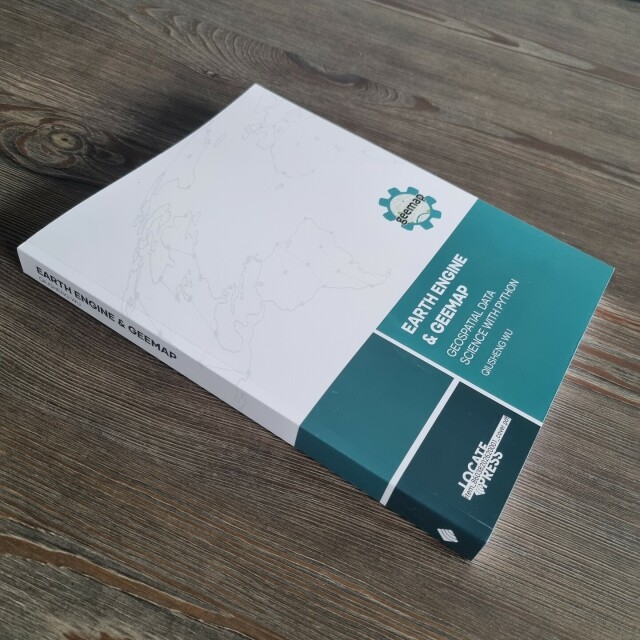
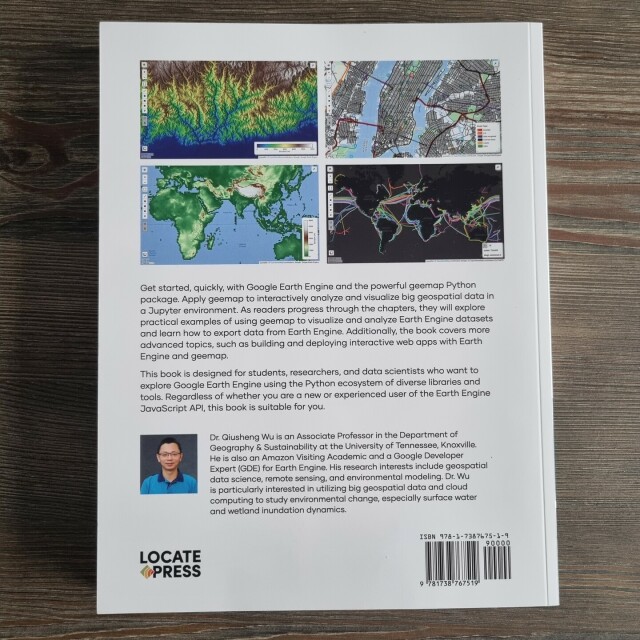
New Release: Earth Engine & Geemap by Qiusheng Wu
A year ago we launched a preview chapter of Qiusheng Wu’s new book and the time has come to launch the full release! We are thrilled to unveil our newest book, Earth Engine and Geemap: Geospa…Locate Press Blog