Search
Items tagged with: day2
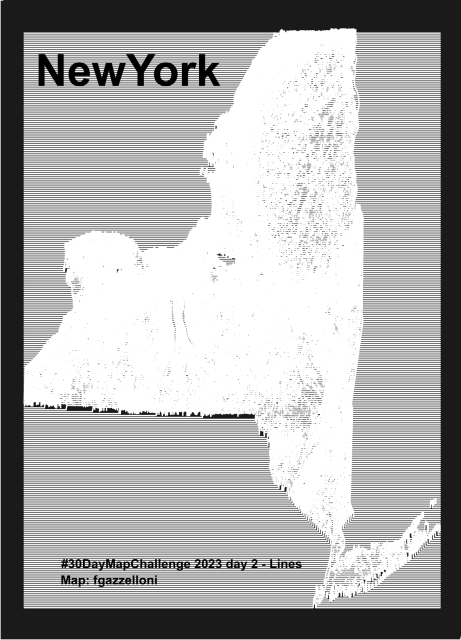
🌎 #30DAyMapChallenge 2023 #day2 - #Lines
NewYork data from USDA NRCS Geospatial Data Gateway. Made with {topo.ridges} packages
Tools: #R
#rstats #datascience #Datavisualization #maps #infographics
NewYork data from USDA NRCS Geospatial Data Gateway. Made with {topo.ridges} packages
Tools: #R
#rstats #datascience #Datavisualization #maps #infographics

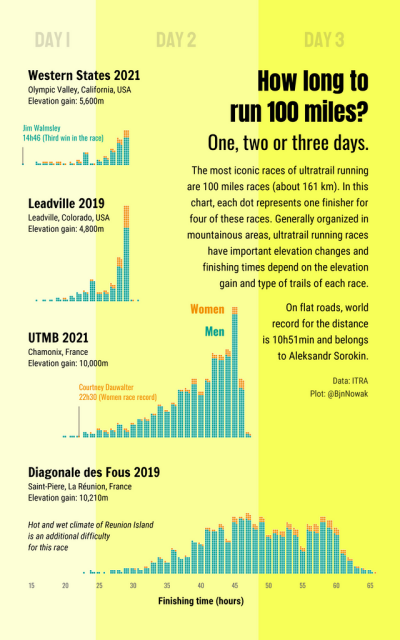
How long to run 100 miles? An old #DataViz for #Day2 of #30DayChartChallenge but I like the subject of this one, as well as the way to use the waffle plots to make a distribution curve
Data from #TidyTuesday, #RStats code here: https://github.com/BjnNowak/TidyTuesday/blob/main/SC_Ultra_Distribution.R
Data from #TidyTuesday, #RStats code here: https://github.com/BjnNowak/TidyTuesday/blob/main/SC_Ultra_Distribution.R
TidyTuesday/SC_Ultra_Distribution.R at main · BjnNowak/TidyTuesday
Contribute to BjnNowak/TidyTuesday development by creating an account on GitHub.GitHub