Search
Items tagged with: datavisualization
📣 Check out my latest 🏗️ WIP 🏗️ project! I want to make it easier to access visualization papers.
https://www.vispubs.devinlange.com/
Stay tuned for updates! #visualization #datavis #datavisualization

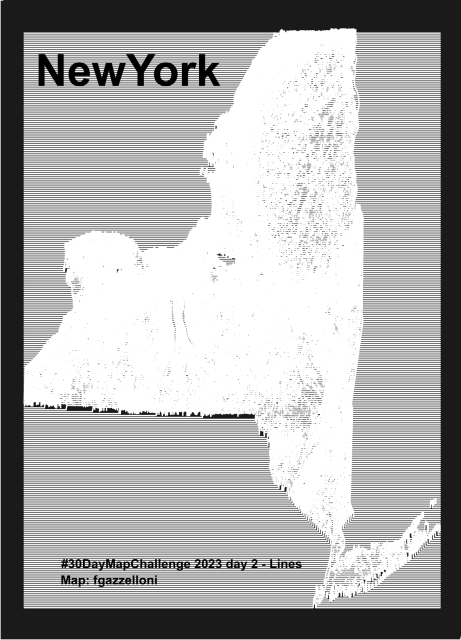
NewYork data from USDA NRCS Geospatial Data Gateway. Made with {topo.ridges} packages
Tools: #R
#rstats #datascience #Datavisualization #maps #infographics
Cedric Scherer is our guest, please check out his website: https://www.cedricscherer.com
Don't miss out on this opportunity to learn from the best in the field. Save the date and click the following link to register for the webinar (https://meetu.ps/e/MBdBk/13177c/i). See you there! 📈🌐 #DataVizNovember #Webinar #DataVisualization #CedricScherer #LearnFromTheBest #Rladiesrome #rladies #rglobal @rladiesrome
 Exciting Data Visualizations with ggplot2 Extensions")
(Even More) Exciting Data Visualizations with ggplot2 Extensions
This time we will have **[Cédric Scherer](https://www.cedricscherer.com/)**, who is a **data visualization designer**, **consultant**, and **instructor** hMeetup
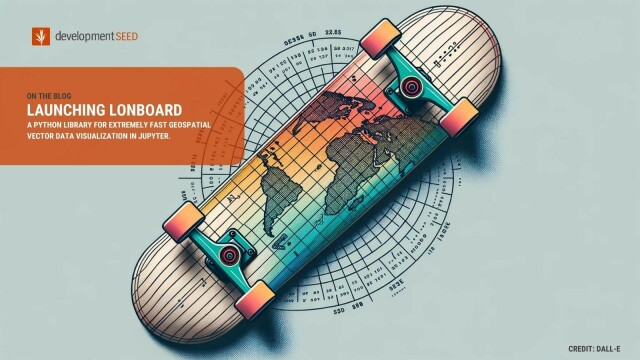
At #foss4gna yesterday @kylebarron introduced a new tool:
🛹 𝒍𝒐𝒏𝒃𝒐𝒂𝒓𝒅 is a game-changer for geospatial data visualization in Jupyter. Say goodbye to slow rendering times!
🔗 bit.ly/lonboard
🧵
#DataVisualization #Geospatial
#DataVisualization


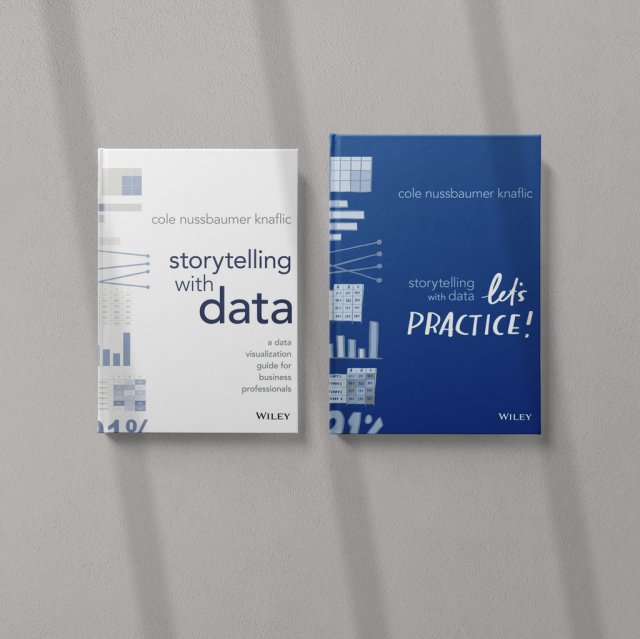
📚 The Data Viz Bookshelf is back!
Every other week, I post a review from my data viz bookshelf on LinkedIn and on my blog. Check it out!
https://www.datarocks.co.nz/linktree
This week: Storytelling with Data by Cole Nussbaumer Knaflic
#datafam
#datavizbookshelf
#datavisualization
#dataviz
#datastorytelling
#vissocial
LINKTREE | Data Rocks NZ
Data Rocks | Information Design | Data Visualisation | New Zealand | Follow on Social Media | Subscribe to the newsletter | Check the blogData Rocks NZ

Sketch Package looks to add JavaScript to R packages - R Consortium
Jackson Kwok, Infrastructure Steering Committee (ISC) recipient for the 2020 cycle, discusses the project Sketch and its implementation in 2021 as an R Package in the CRAN environment. The Sketch...R Consortium
📢 In questa puntata parliamo di: #GDPR #ChatGPT #Privacy #AI #DataVisualization #Telegram
📧 Puoi consultarla online o riceverla nella tua e-mail
https://buttondown.email/opengenova/archive/da-zero-a-digital-newsletter-ndeg-14/

Da zero a digital » Newsletter n° 14
Newsletter n° 14 » 9 aprile 2023In questa newsletter parliamo di:Intelligenza artificiale, l’umanità è a un bivio esistenziale: ecco le scelteIntelligenza...buttondown.email
https://nightingaledvs.com/the-30daychartchallenge-year-three/
30 days, 30 charts, 5 categories 📈
The 3rd edition starts in 4⃣ days!
#datavisualisation #datavis #datavisualization

The #30DayChartChallenge Is Ready to Kick Off - Nightingale
The #30DayChartChallenge is a data visualization community challenge to create a visualization on a particular theme each day in April.Cédric Scherer (Nightingale)