Search
Items tagged with: webgl
For this map I added a glitch to the way I'm tessellating geometry by randomly throwing out vertices.
https://willjfield.github.io/30-Day-Map-Challenge/Day4/#5/45.28/-83.94
#30DayMapChallenge #glsl #shaders #webgl
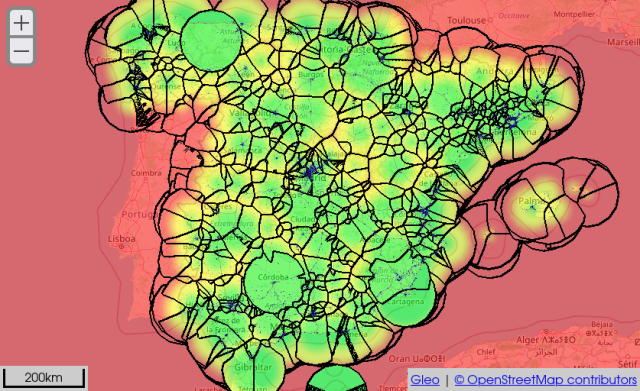
"intensify" symbol decorator. Take any solid-colour existing symbol (e.g. a circle fill), and replace its colour with the intensity added to a scalar field (like a heatmap).
Note that the HeatMap-specific "HeatPoint" has fading intensity, whereas the intensified circles have constant intensity.
#WebGL #dataviz #GISchat
You can follow the work here: https://github.com/openlayers/openlayers/pull/14445
#OpenSource #osgeo #gischat
![[WIP] WebGL vector tile renderer by jahow · Pull Request #14445 · openlayers/openlayers](https://friendica.opencloud.lu/photo/preview/640/146370)
[WIP] WebGL vector tile renderer by jahow · Pull Request #14445 · openlayers/openlayers
Currently work in progress. This PR is a first attempt at getting a webgl-based vector tile renderer running. The approach is as follows: Rely on MixedGeometryBatch and BatchRenderer used in the w...GitHub
Reinventing line joins
I’ve been working on Gleo for months now. When I started with it, I was pretty sure I had to reinvent big chunks of a vector rendering pipeline, come with te...ivan.sanchezortega.es
Time to give you a go and see if you're a viable alternative for data, visualisation and renewable energy related stuff.
I've attached a fun map of "live" wind turbine output that I've been working on recently as a little taster of what's to come ⚡️
Here's my Twitter if you're curious who I am: https://twitter.com/robhawkes
#followfriday #introduction #energy #renewablenergy #maps #gis #dataviz #webgl


