Search
Items tagged with: 30DayMapChallenge
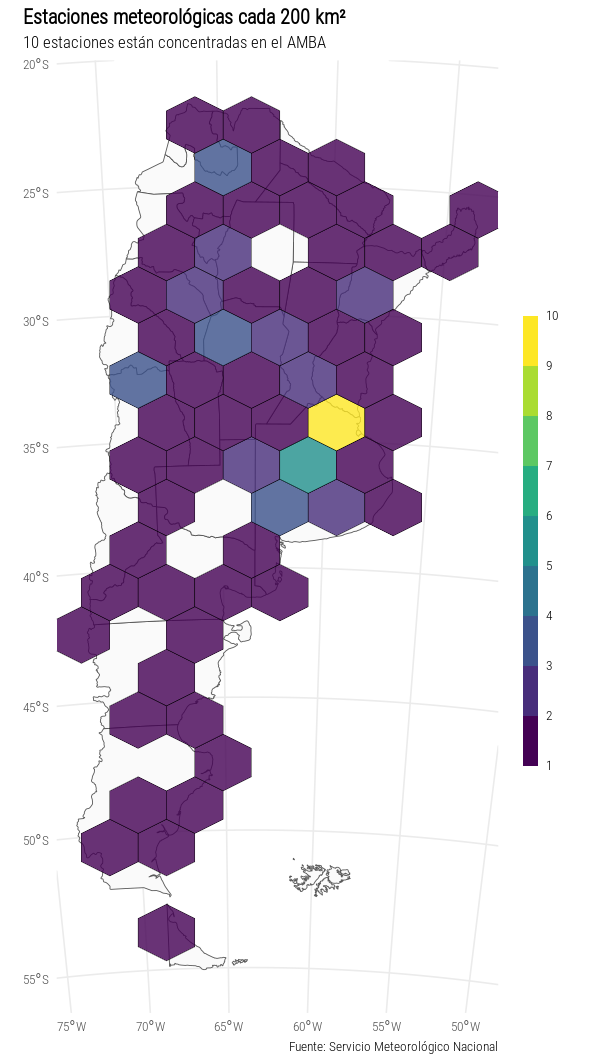
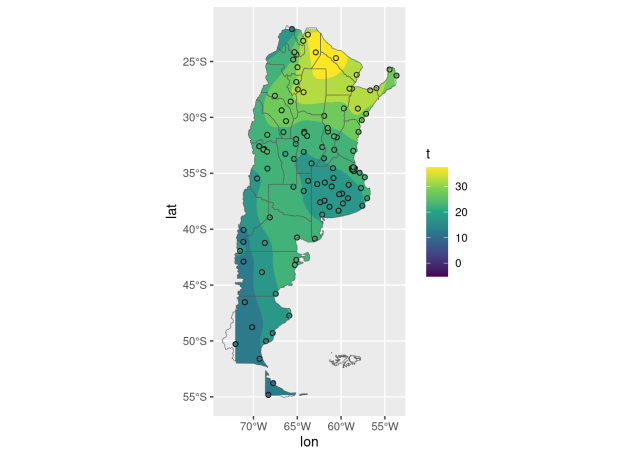
Esta es otra manera de ver la distribución desigual de estaciones meteorológicas en Argentina. Y si bien el gráfico es simple, aprendí varias cosas hoy.
Código y detalles: paocorrales.github.io/30DayMapChallenge2023/day9.html
Día 9: Hexagons. 6 sides, 6 angles, and 6 vertices
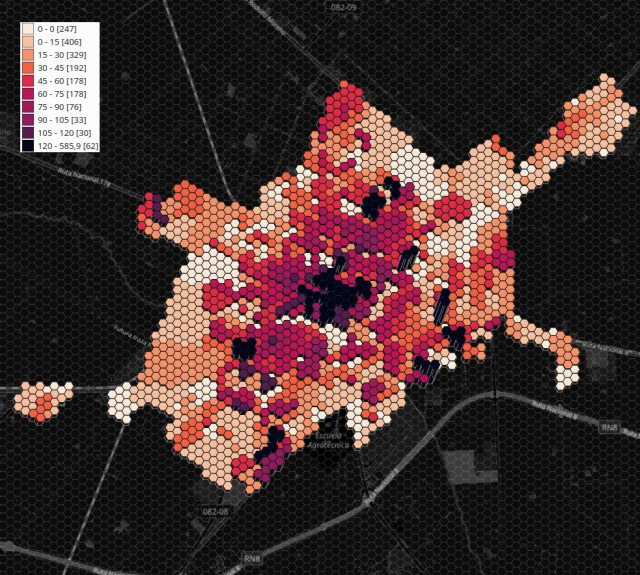
Proyección cantidad de habitantes por hexágono (INDEC+IDE Pergamino) (r=200)
#OpenStreetMap #IDE #Pergamino
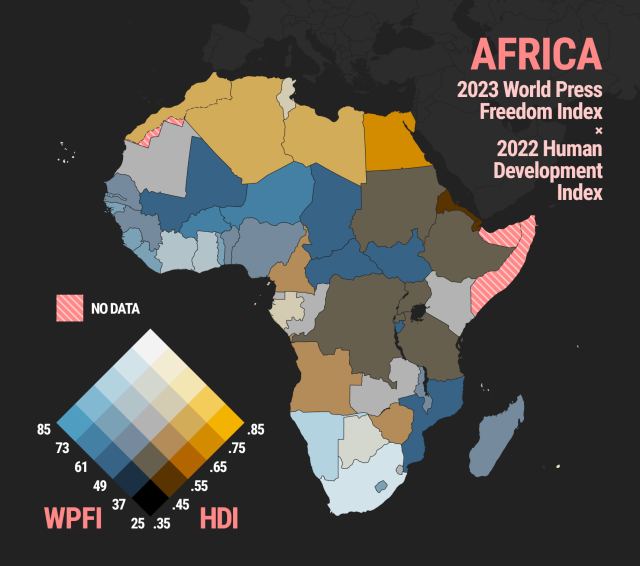
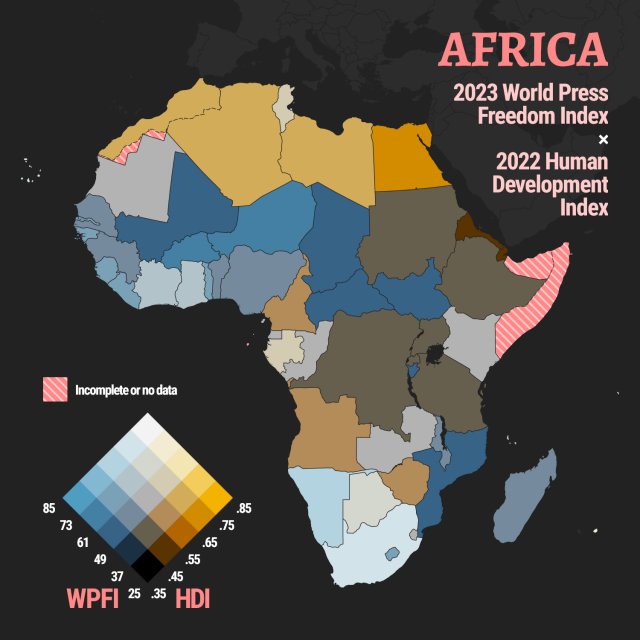
I decided to try something new and create my very first #bivariate #choropleth map! The two variables I’ve mapped for 52 African countries are the 2023 #WorldPressFreedomIndex scores by #ReportersWithoutBorders and the 2022 #HumanDevelopmentIndex by the UN Development Programme.
Unfortunately São Tomé and Príncipe didn’t have a WPFI score while there’s no HDI for Somalia. Of course Western Sahara had no data too.
#HDI #RSF #PressFreedom #WPFI
1/4
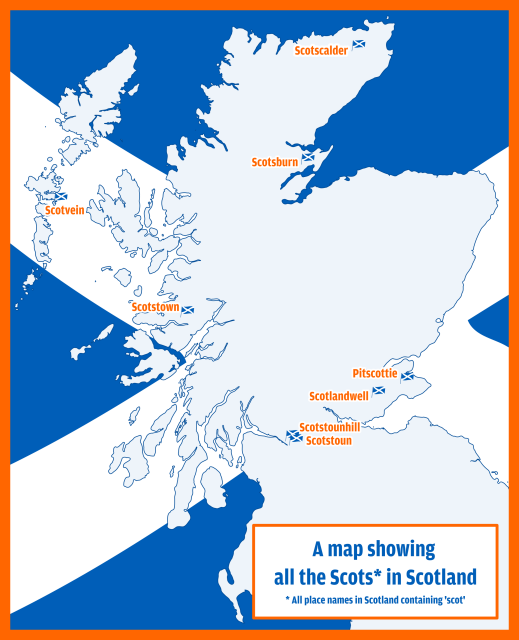
Anyway, here's my bad map titled 'All the Scots in Scotland' which shows all places with 'scot' in their name. And yes, I have used Irn Bru colours, what's your problem? 😉
Data came from #OpenStreetMap Made in #QGIS and #inkscape
#Scotland #maps #irnbru
For this map I added a glitch to the way I'm tessellating geometry by randomly throwing out vertices.
https://willjfield.github.io/30-Day-Map-Challenge/Day4/#5/45.28/-83.94
#30DayMapChallenge #glsl #shaders #webgl
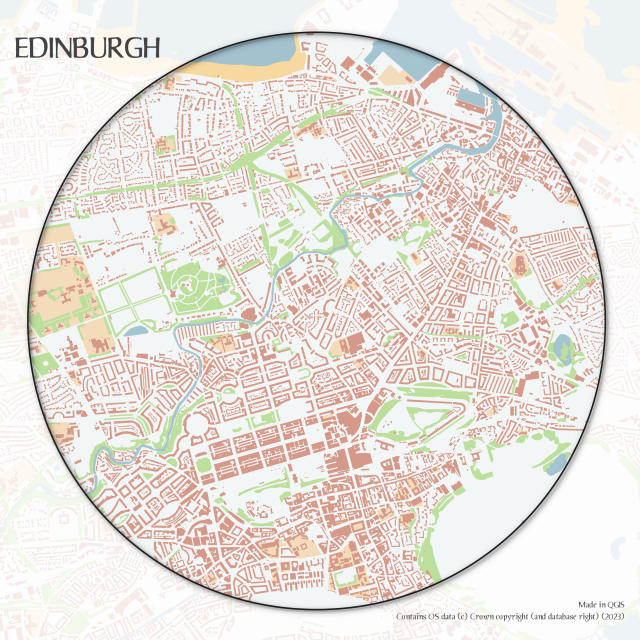
Growing up I heard a stat that Edinburgh had more golf courses within the city limits than any other city in the world. I don't know if that is true but there certainly are a lot!
some wavy sine curves of the U.S.A., admittedly a rather liberal interpretation of analog
code: https://github.com/curatedmess/30DayMapChallenge/blob/main/2023/11052023/usa_waves.R
#rstats
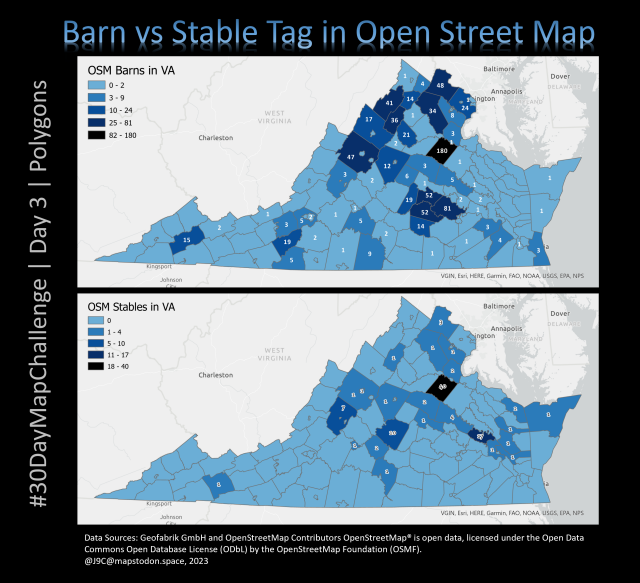
#30DayMapChallenge #OpenStreetMap #Virginia #chloropleth #barns #stables #HorsesOfMastodon #Horsetodon #horse #equestrian #DMV
https://eliocamp.github.io/codigo-r/en/2023/11/kriging-metr-r/
Consider this my entry for days 1-3 for #30DayMapChallenge
#RStats
Kriging with metR
Say you have data measured at different weather stations, which in Argentina might look something like this estaciones[data, on = c("nombre" = "station")] |> ggplot(aes(lon, lat)) + geom_point(aes(color = t)) + geom_sf(data = argentina_provincias, in…Code R
Centre of Edinburgh - OS Open Zoomstack polygon layers
#OSOpen #QGIS
