Search
Items tagged with: 30DayMapChallenge
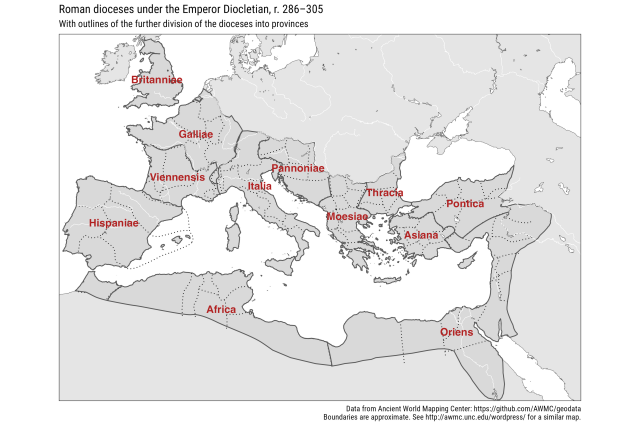
Data: https://github.com/AWMC/geodata
Code: https://github.com/jessesadler/30daymapchallenge/blob/main/3-polygons.R
#rspatial #DigitalHumanities #DigitalHistory
GitHub - AWMC/geodata: The geodata collection of the Ancient World Mapping Center in GeoJSON format.
The geodata collection of the Ancient World Mapping Center in GeoJSON format. - GitHub - AWMC/geodata: The geodata collection of the Ancient World Mapping Center in GeoJSON format.GitHub
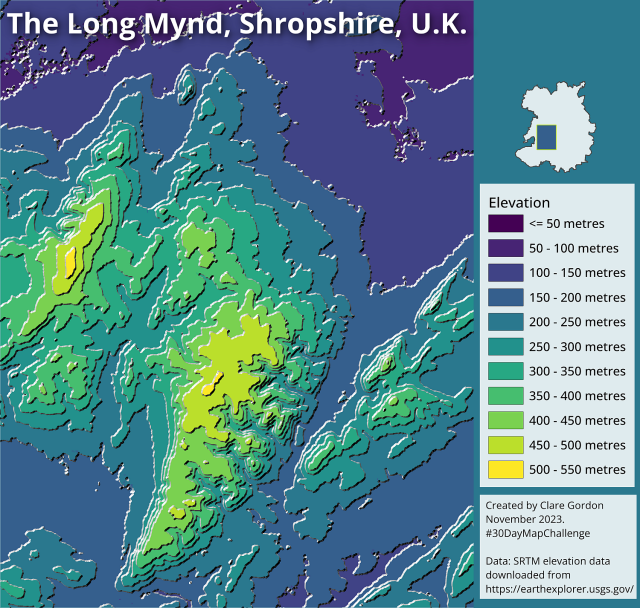
Elevation data from SRTM.
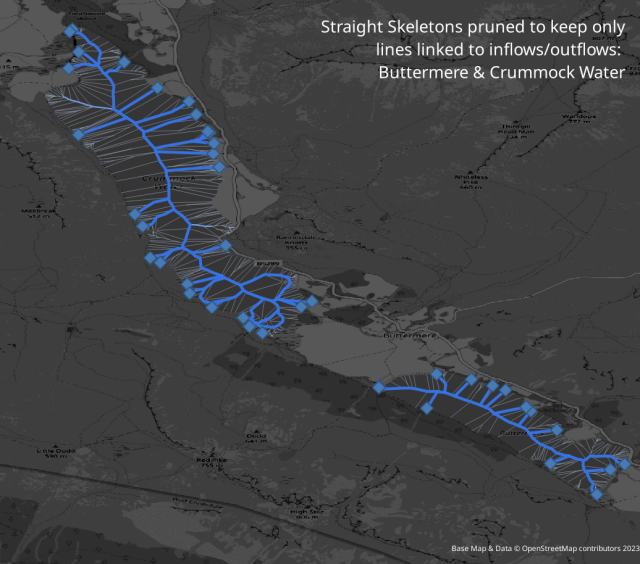
Last day 2 map for #30DayMapChallenge (lines) is related to this day 1 point map https://en.osm.town/@SK53/111337236337206381.
There has been a lot of interest within #OpenStreetMap about the best way to map hydrological networks and particularly if continuity should be kept through lakes.
The map shows progressive stages of pruning a straight skeleton of a couple of lakes retaining lines linked to outflows.
PS. I've played with these before sk53-osm.blogspot.com/2016/10/skeletons-in-water.html
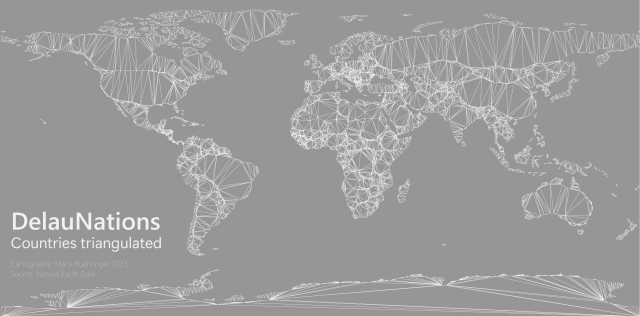
DelauNations - A Delaunay triangulation of country borders 📐🗺️
Tools: #QGIS
Data: Natural Earth
#gischat
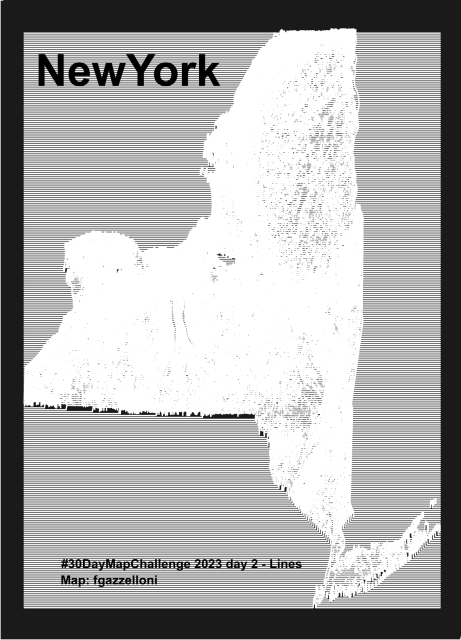
NewYork data from USDA NRCS Geospatial Data Gateway. Made with {topo.ridges} packages
Tools: #R
#rstats #datascience #Datavisualization #maps #infographics
1) There's a v. good reason line widths are kept to 1px in webgl (hint: tessellation) https://blog.scottlogic.com/2019/11/18/drawing-lines-with-webgl.html
2) setData() in @maplibre is actually very inexpensive on cpu & easy to implement for animations
3) CSV to geojson is easy in @qgis but managing timestamps in general is hard
4) Output from challenges < lessons learned so Keep It Simple Stupid
Drawing Lines with WebGL
Connecting points on a chart with a line is one of the most basic uses of a charting library. When drawing that line in WebGL, however, it's not as straightforward as you might think.Scott Logic
#rayshader adventures, an #rstats tale
This is why I created a brainstorming doc to organize all my ideas. Feel free to save a copy and use it for your own! More maps shared means the world is a mappier place! https://docs.google.com/spreadsheets/d/1auCdPIG1p811-MJ0CmxmmE_CVDL33yYYbMM_MjLq0SE/edit?usp=sharing

30 Day Map Challenge 2023
Brainstorming Date,Theme,Details,Brainstorming Ideas,Data Source 1,11/1/2023,Points,A map with points 2,11/2/2023,Lines,A map with lines 3,11/3/2023,Polygons,A map with polygons 4,11/4/2023,A bad map,Let's get this over with 5,11/5/2023,Analog Map,N…Google Docs


